The Geography of Life: Understanding Species Distribution and Range
Ever wondered why some animals are found across entire continents while others exist only on a single, isolated mountain peak? In biology, this spatial arrangement is known as species distribution (or species dispersion). It describes how a biological taxon—a group of one or more organisms sharing common characteristics—is spread across a geographic area.
Understanding distribution is more than just mapping locations; it is about uncovering the complex relationship between an organism and its environment. To study this, scientists distinguish between the range (the total geographic limits where a species can be found) and dispersal (the actual movement of individuals away from their origin or a high-density population center).
Defining the Species Range
A species' range is the entire geographical area where it can be found. However, not all ranges are the same. Biologists use specific terms to describe how a species occupies its space:
- Native or Endemic Range: The area where a species historically originated and naturally lives.
- Introduced or Invasive Range: Areas where a species has recently established itself, often transported by humans across geographical barriers.
- Seasonal Ranges: Many species shift their location based on the time of year, leading to the designation of summer and winter ranges.
- Breeding vs. Non-breeding Range: For species that only use specific areas for reproduction.
- Disjunct Distribution: This occurs when two or more areas of a species' range are significantly separated from one another geographically.
For mobile animals, scientists may distinguish between their natural range and areas where they appear as vagrants—individuals that have wandered far outside their usual range.
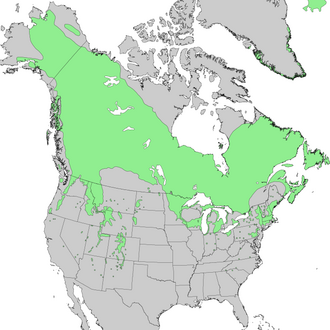
Factors That Shape Distribution
Species do not spread randomly; their presence is dictated by a combination of abiotic (non-living) and biotic (living) factors.
Abiotic Factors
Non-living environmental variables are primary drivers of where a species can survive. These are generally categorized into three types:
- Climatic factors: Including temperature, humidity, sunlight, salinity, and atmospheric conditions.
- Edaphic factors: Soil-related variables such as pH levels, aeration, local geology, and soil coarseness.
- Social factors: Human-driven influences like land use and the availability of water.
Climate change is currently shifting these boundaries. For example, the Arctic Ocean Diversity (ARCOD) project—part of the larger Census of Marine Life—has documented warm-water crustaceans moving into the cold waters around Norway's Svalbard Islands. Notably, the snow crab has extended its range 500 km north as ocean temperatures rise.
Biotic Factors
Living interactions also dictate spatial patterns. Predation, disease, and competition for food, water, and mates play critical roles. For instance, a quail's distribution is influenced by its prey (seeds and insects) and its predators (such as coyotes).
Other biological drivers include:
- Phenology: The study of the timing of biological events (like flowering or migration), which acts as an adaptive trait for fitness in changing climates.
- Physiology: An organism's internal biological functions influence its ability to explore and disperse. Individuals with higher metabolism and immunity are often more prone to dispersal.
- Allelopathy: Some plants, such as Salvia leucophylla in California, release chemicals (terpenes) that inhibit the growth of nearby plants, forcing a specific spatial arrangement.
- Human Activity: Globalization and shipping have accelerated distribution. Large tankers often transport aquatic species across oceans via ballast water.
Patterns of Dispersion: Small vs. Large Scales
While distribution patterns on a large scale are typically clumped, small-scale patterns vary based on resource availability and social behavior.
Clumped Distribution
Also known as aggregated distribution or patchiness, this is the most common pattern in nature. It occurs when resources are patchy or when social factors—such as family groups or "selfish herds"—drive individuals together. For example, African wild dogs (Lycaon pictus) use communal hunting in packs to increase their success rate. Similarly, during the dry season in Africa, various species like lions, elephants, and giraffes clump around limited water sources.
Uniform Distribution
Uniform (or even) distribution occurs when individuals maximize the distance between one another. This is usually a result of intense competition for resources or territoriality. Penguins often exhibit this pattern by aggressively defending their personal space. In the southwestern U.S., creosote bushes maintain uniform spacing to reduce competition for moisture.
Random Distribution
The rarest pattern, random distribution occurs when the position of one individual is independent of others. This happens in habitats where resources are consistent and there are no strong social attractions or repulsions. Examples include dandelion seeds dispersed by wind or oyster larvae carried by unpredictable sea currents.
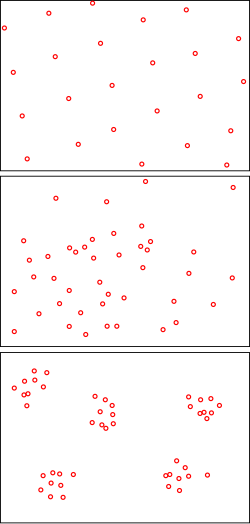
| Pattern | Spacing | Primary Cause | Example |
|---|---|---|---|
| Clumped | Minimized distance | Patchy resources, social bonds, predator defense | African wild dogs, water-hole gatherings |
| Uniform | Maximized distance | Territoriality, resource competition, allelopathy | Penguins, creosote bushes |
| Random | Unpredictable | Consistent resources, lack of social interaction | Dandelion seeds, oyster larvae |
Measuring and Modeling Distribution
To move beyond observation, ecologists use statistical methods to determine the exact nature of a population's dispersion.
Statistical Methods
One common approach is the Clark–Evans nearest neighbor method. Researchers measure the distance from an individual to its closest neighbor. By calculating a ratio (R), they can determine the pattern: if R = 1, it is random; if R > 1, it is uniform; and if R < 1, it is clumped.
Another approach is the Variance/Mean ratio method, which compares the number of individuals in random sample plots against a Poisson distribution (a mathematical model for random events). A ratio equal to 1 indicates random distribution, while a ratio significantly higher than 1 indicates clumping.
Species Distribution Models (SDMs)
Modern ecology relies on SDMs to predict where species might move due to climate change. These models create a "bio-climate envelope" by integrating data on dispersal, disturbance, and resource limits. However, the accuracy of these models can be affected by grid size. Research shows that using a 50x50 km grid can over-predict a species' range by up to 2.89 times compared to a 1x1 km grid, which could lead to the misidentification of protected habitats.
Efforts like the Species Distribution Grids Project at Columbia University aim to refine these maps. By creating comprehensive databases for amphibians, birds, and mammals, the project helps prioritize areas for conservation and combat deforestation based on species richness.