Human Development Index: Measuring Global Progress Beyond GDP
For decades, the success of a nation was measured almost exclusively by its economic output. However, the Human Development Index (HDI) shifted this paradigm by arguing that people, not just economies, are the true measure of development. Developed by Pakistani economist Mahbub ul-Haq and utilized by the United Nations Development Programme (UNDP), the HDI is a statistical composite index used to rank countries into four tiers of human development.
At its core, the HDI is based on the human development approach, which is anchored in Amartya Sen's work on human capabilities. This framework focuses on whether individuals have the freedom to "be" and "do" desirable things—such as being healthy and sheltered, or doing meaningful work and participating in community life. Crucially, it distinguishes between forced deprivation and personal choice, such as the difference between fasting for religious reasons and suffering from famine.
![The underlying principle behind the Human Development Index[6]](/images/f0/bc/f0bc33e390f86ecde26ea4242860f7f2c21c7d70012f521fcf2c8268da5769aa.webp)
Key Facts
- Purpose: To shift development focus from national income accounting to people-centered policies.
- Core Dimensions: Life expectancy, education, and per capita income.
- Governing Body: The UNDP's Human Development Report Office.
- Key Innovation: The Inequality-adjusted HDI (IHDI) accounts for disparities within a population.
- Top Performers: Norway has historically held the highest rank more often than any other nation.
Origins and Evolution
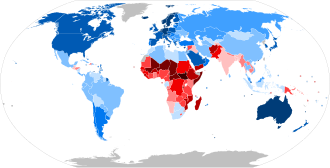
The HDI was launched in 1990 to convince policymakers and the public that economic advances alone do not equate to human well-being. By combining multiple indicators into a single score, the UNDP created a tool that could challenge the dominance of GDP as the sole metric of progress.
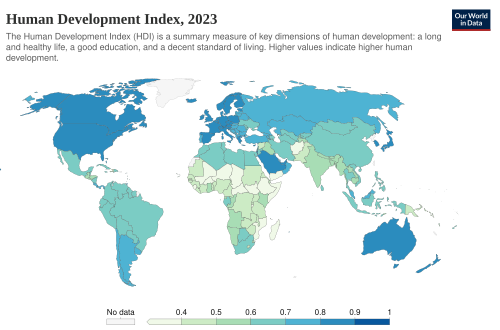
Over time, the index has expanded its reach. While the 2010 HDI covered 169 countries, other researchers like David Hastings have extended the geographical coverage to over 230 economies to provide a more comprehensive global view.
How the HDI is Calculated
The methodology for calculating the HDI evolved significantly in 2010 to reduce the "substitutability" between dimensions. This means that a very high score in income cannot fully mask a very low score in health or education.
The Modern Method (2010–Present)
The current HDI is the geometric mean of three normalized indices:
- Life Expectancy Index (LEI): Based on life expectancy at birth. A score of 1 is assigned to 85 years, and 0 to 20 years.
- Education Index (EI): A combination of two metrics: Mean Years of Schooling (average years of education for adults 25+) and Expected Years of Schooling (total years a child is expected to receive).
- Income Index (II): Based on Gross National Income (GNI) per capita adjusted for Purchasing Power Parity (PPP). A score of 1 is assigned to $75,000 and 0 to $100.
The Legacy Method (Pre-2010)
Before 2010, the HDI used a uniformly weighted sum. It measured knowledge through adult literacy rates (weighted two-thirds) and gross enrollment ratios (weighted one-third), and used the natural logarithm of GDP per capita for the standard of living.
Comparing HDI and IHDI
A significant limitation of the standard HDI is that it relies on national averages, which can hide deep internal inequalities. To address this, the 2010 Human Development Report introduced the Inequality-adjusted Human Development Index (IHDI).
The UNDP describes the HDI as a measure of "potential" human development—the level that could be achieved if there were no inequality. In contrast, the IHDI represents the actual level of human development by discounting the HDI value based on the level of inequality within the country.
Analysis of Global Trends
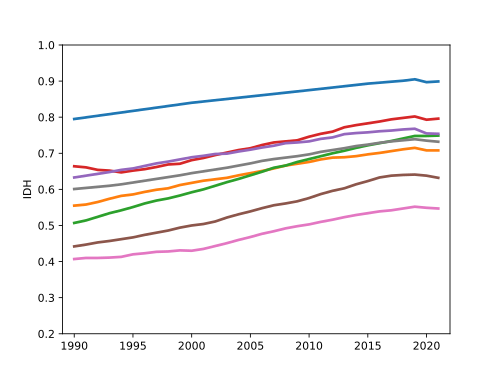
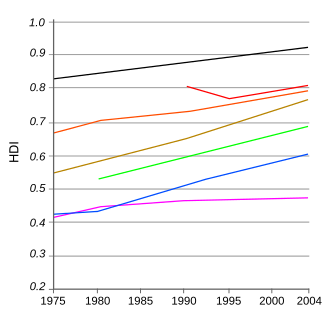
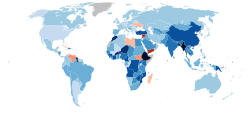
The HDI provides a longitudinal view of how nations progress. Historical data shows varying trajectories, with some nations seeing rapid growth in education and health despite slower economic gains.
| Dimension | Indicator | Goal/Maximum Value (Modern) |
|---|---|---|
| Health | Life Expectancy at Birth | 85 Years |
| Education | Mean & Expected Schooling | 15 (Mean) / 18 (Expected) Years |
| Standard of Living | GNI per capita (PPP) | $75,000 |
Criticisms and Limitations
Despite its utility, the HDI is not without critics. Some economists argue that the index suffers from measurement errors in underlying statistics and that the thresholds used to categorize countries (e.g., "Medium" vs "High") can be arbitrary.
Other primary criticisms include:
- Lack of Quality Metrics: The education index measures the quantity of schooling but not the quality of learning.
- Omissions: The index does not account for net wealth per capita, unemployment, democracy, or the relative quality of goods.
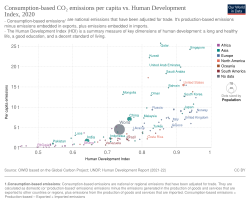
- Sustainability: Early versions ignored environmental impact, leading to the later development of the planetary pressures-adjusted HDI.
Frequently Asked Questions
What is the difference between HDI and GDP?
GDP (Gross Domestic Product) measures only the economic output of a country. HDI is a broader measure that combines economic data (GNI per capita) with social indicators like life expectancy and education to assess overall human well-being.
Who created the Human Development Index?
The index was devised and launched in 1990 by Pakistani economist Mahbub ul-Haq, with theoretical foundations based on the work of Amartya Sen.
Why was the calculation method changed in 2010?
The UNDP switched to a geometric mean to reduce the substitutability between dimensions. This ensures that poor performance in one area (like health) cannot be completely offset by high performance in another (like income).
What does the IHDI measure?
The Inequality-adjusted Human Development Index (IHDI) adjusts the standard HDI to account for inequality within a country's population, providing a more accurate picture of the actual development experienced by the average citizen.
Which country typically ranks highest on the HDI?
Norway has historically been the top-ranked country most frequently, followed by other nations such as Canada, Iceland, Switzerland, and Japan.