Safety in Numbers: How Group Dynamics Reduce Individual Risk
The concept of safety in numbers is the hypothesis that an individual is less likely to experience a mishap, accident, or attack when they are part of a large physical group. While it may seem counterintuitive that more people in a given space could lead to fewer accidents, this phenomenon is observed across various fields, from evolutionary biology to urban traffic management.
Beyond simply redistributing risk across a larger population, some theories suggest that mass behavior makes individuals more predictable to others. In the context of traffic, this predictability can create an actual reduction in danger, fundamentally changing the environment to be safer for everyone involved.
Key Facts
- Biological Defense: Animals use grouping behaviors, such as schooling and herding, to reduce their individual "domain of danger."
- Traffic Non-linearity: The risk to individual pedestrians and cyclists often decreases as the total number of people using those modes of transport increases.
- Predictability: Higher volumes of cyclists and pedestrians can make them more visible and predictable to motorists.
- Global Evidence: Data from the UK, Netherlands, Denmark, and the US support the inverse correlation between user volume and individual risk.
Biological Foundations: The Selfish Herd
In 1971, mathematical biologist W.D. Hamilton introduced the selfish herd theory. This theory posits that animals seek central positions within a group to minimize their own "domain of danger"—the area around an individual where they are the most likely target of a predator. By surrounding themselves with neighbors, individuals push the risk toward the periphery of the group.
This behavior is evident in several species: birds flock, sheep herd, and fish school. A specific example is seen in Adelie penguins, which often wait for a large group to assemble before jumping into the water to reduce the individual risk of seal predation.
Other biological strategies include masting and predator satiation. In these instances, prey species produce an overwhelming abundance of offspring or resources in a short window, saturating the predators' capacity to eat and ensuring that a higher percentage of the population survives.
Research using decoy seals demonstrated this effect in practice; seals with a larger domain of danger (those further from the center of a group) faced a significantly higher risk of attack by great white sharks.
Road Traffic Safety and Urban Mobility
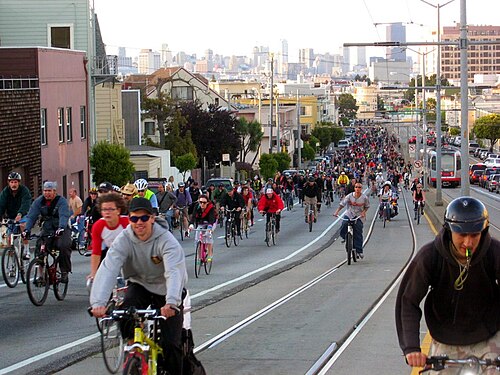
In urban environments, safety in numbers describes the inverse correlation between the number of pedestrians or cyclists and the risk of a motorist colliding with them. This is a non-linear relationship, meaning that as the number of people walking or cycling increases, the number of injuries does not rise at the same rate. Consequently, the individual risk actually drops.
This effect has been confirmed through ecologic data from Denmark, California, and various European countries, as well as time-series data from the Netherlands and the United Kingdom.
Case Studies in Cycling Growth
Several cities provide empirical evidence that increased usage leads to improved safety outcomes:
- New York City (1999–2007): While the amount of cycling increased by 98%, the absolute number of cyclists killed or seriously injured decreased by 29%.
- Copenhagen (1995–2006): Cycling increased by 44% and the percentage of commuters cycling rose from 31% to 36%, yet serious injuries fell by 60%.
- The Netherlands (1980–2005): Cyclist fatalities decreased by 58% despite a 45% increase in cycling.
- Portland, Oregon: Between 1992 and 2008, the number of bicyclists crossing four downtown bridges increased by 369%, while reported crashes rose by only 14%.
Infrastructure and Behavioral Adaptation
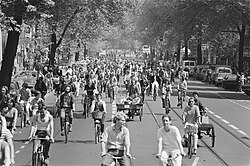
The relationship also works in reverse: improved safety infrastructure encourages more people to use a route, which then further enhances safety through the safety-in-numbers effect. For example, in Canberra, the number of cyclists on Northbourne Avenue between 7:30 am and 9:00 am trebled from 40 in 2004 to 121 in 2005 following the completion of an on-road cycle lane.
| Location | Metric Change | Safety Outcome |
|---|---|---|
| New York City | 98% increase in cycling | 29% decrease in serious injuries/deaths |
| Copenhagen | 44% increase in cycling | 60% decrease in serious injuries/deaths |
| Netherlands | 45% increase in cycling | 58% decrease in fatalities |
| Portland, OR | 369% increase in bridge crossings | Only 14% increase in reported crashes |
Frequently Asked Questions
Does more people on the road always mean more accidents?
Not necessarily. While the absolute number of accidents may increase slightly, the risk per individual often decreases because the increase in users is not linear with the increase in crashes.
What is the "domain of danger" in biology?
The domain of danger is the area surrounding an individual animal where it is the most likely target for a predator. By moving to the center of a group, an animal reduces this area by placing other individuals between itself and the threat.
How does predator satiation work?
Predator satiation occurs when prey species produce such a massive abundance of individuals in a short time that predators cannot possibly eat them all, allowing a larger portion of the population to survive.
Why does a higher volume of cyclists make them safer?
Higher volumes make cyclists more visible and predictable to motorists. This behavioral adaptation by drivers, combined with increased awareness, reduces the likelihood of collisions per individual cyclist.
Is the safety in numbers effect seen in pedestrians as well?
Yes. Data from signalized intersections in Canada and various cities in California indicate that pedestrian risk often decreases as pedestrian flow increases.