NESIS Scale: Measuring the Impact of Northeastern Snowstorms
In the densely populated regions of the Northeastern United States, a heavy snowfall is more than just a weather event; it is a significant economic and logistical challenge. To better quantify these effects, meteorologists developed the NESIS (Northeast Snowfall Impact Scale). Unlike traditional weather reports that focus solely on snowfall totals, this system measures the actual impact a storm has on transportation and the economy.
The scale was co-created by Paul Kocin of The Weather Channel and Louis Uccellini of the National Weather Service. By analyzing how a storm interacts with major cities and infrastructure, NESIS provides a standardized way to categorize the severity of winter weather events across the region and the country.
Key Facts
- Purpose: Measures the economic and transportation impact of snowstorms rather than just snowfall depth.
- Creators: Developed by Paul Kocin (The Weather Channel) and Louis Uccellini (National Weather Service).
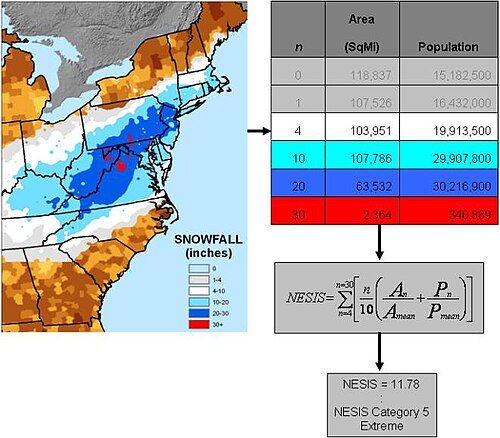
- Variables: Calculations are based on the area affected, the amount of snowfall, and the population density in the storm's path.
- Application: Used for reevaluating past storms rather than as a predictive forecasting tool like hurricane scales.
- Rarity: Only three storms in history have reached the highest Category 5 designation.
How the NESIS Scale Works
The NESIS scale operates by converting raw data into a numerical value. This value is derived from three primary variables: the total area covered by the snow, the depth of the snowfall, and the number of people living within the affected zone. A storm that drops a foot of snow in a remote forest has a much lower impact than a storm that drops the same amount over a major metropolitan hub.
These variables produce a raw data number. A value of "1" represents an insignificant snowfall, while values exceeding "10" indicate massive, high-impact events. Based on this number, storms are sorted into five distinct categories.
NESIS Classification Categories
| Category | NESIS Value | Description |
|---|---|---|
| 1 | 1–2.499 | Notable |
| 2 | 2.5–3.99 | Significant |
| 3 | 4–5.99 | Major |
| 4 | 6–9.99 | Crippling |
| 5 | 10.0+ | Extreme |
Historical Impact and Application
The highest NESIS values are reserved for storms that combine heavy snowfall with vast geographic coverage of major population centers. Because of the strict requirements for Category 5, very few storms have ever achieved this status. Only three historical events have reached a NESIS value higher than 10: the 1993 Storm of the Century, the North American blizzard of 1996, and the January 2016 United States blizzard.
Beyond historical record-keeping, the scale serves a practical purpose for infrastructure management. By understanding the impact level, meteorologists can better estimate the duration of airport delays and determine when regional operations will return to normal.
It is important to note that NESIS is not a forecasting tool. According to Louis Uccellini, the scale is intended to reevaluate the impact of snowstorms after they have occurred, distinguishing it from the predictive nature of hurricane category forecasts.
Frequently Asked Questions
What does NESIS stand for?
NESIS stands for the Northeast Snowfall Impact Scale.
Who created the NESIS scale?
The scale was created by Paul Kocin of The Weather Channel and Louis Uccellini of the National Weather Service.
What factors determine a storm's NESIS value?
The value is calculated based on the amount of snowfall, the total area affected, and the population density of the people living in the storm's path.
Is NESIS used to predict future snowstorms?
No, NESIS is used to reevaluate the impact of storms after they happen; it is not used as a forecasting tool like those used for hurricanes.
Which storms have reached Category 5?
Only three storms have reached Category 5 (a value over 10): the 1993 Storm of the Century, the North American blizzard of 1996, and the January 2016 United States blizzard.