NESIS: Measuring the Impact of Northeast Snowstorms
Measuring the severity of a winter storm requires more than just looking at the total inches of snow in a single city. To truly understand the societal and economic disruption caused by winter weather, meteorologists use the Northeast Snowfall Impact Scale (NESIS). This scale evaluates storms based on the distribution of snowfall across populated areas, providing a standardized way to rank the most significant weather events in North American history.
The Evolution of NESIS Data
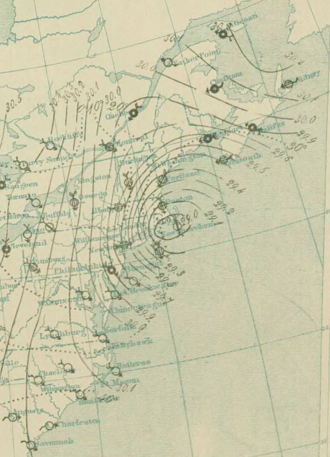
The NESIS framework was originally developed by Paul Kocin and Louis Uccellini in their 2004 study, "A Snowfall Impact Scale Derived From Northeast Storm Snowfall Distributions." In their initial work, they computed values for 70 storms occurring between 1888 and 2003. This provided a historical baseline for how snowfall affects the densely populated Northeast corridor.
In 2005, the National Climatic Data Center (NCDC) sought to productionize this work to ensure that future storms could be rated consistently. The NCDC recomputed values for 30 of the original Kocin/Uccellini storms using updated data and refined methods. Consequently, there are two sets of values for some historical events: the original Kocin/Uccellini ratings and the NCDC recomputations.
Today, the National Centers for Environmental Information (NCEI), a part of NOAA, maintains the official list of rated storms. For historical consistency, storms occurring before 2005 generally use the Kocin/Uccellini rating, while storms from 2005 onward utilize the NCDC methodology.
NESIS Categories and Classifications
The NESIS value determines the category of the storm, ranging from "Notable" to "Extreme." These categories help the public and emergency managers understand the scale of the impact relative to historical norms.
- Category 1: Notable – Storms that cause minor disruptions.
- Category 2: Significant – Storms that create noticeable impacts on travel and daily life.
- Category 3: Major – Storms that cause widespread disruption.
- Category 4: Crippling – Storms that lead to severe paralysis of infrastructure.
- Category 5: Extreme – Rare events that cause catastrophic disruption across the region.
Historical Storm Analysis
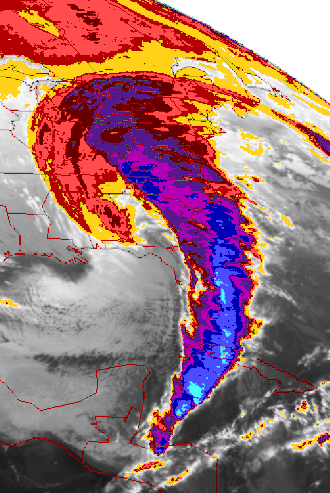
The data reveals a wide spectrum of winter weather events. The highest-ranking storm in the NESIS record is the "Storm of the Century" (March 12–14, 1993), which reached an NCDC value of 13.20, firmly placing it in the Extreme category.
Other Extreme events include the North American blizzard of January 6–8, 1996, and the January 22–24, 2016, blizzard. These events are distinguished not just by the amount of snow, but by the vast geographic area of high-population centers they affected.
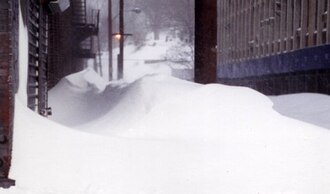
While Extreme storms grab headlines, the region frequently experiences "Crippling" (Category 4) events, such as the Great Blizzard of 1888 and the February 1960 storm, both of which caused massive societal shutdowns.
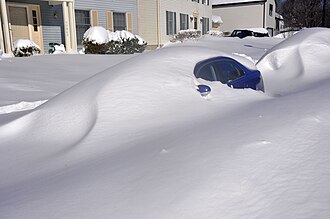
More recent data shows a steady stream of Major and Significant storms, such as the February 2010 events and the January 2021 storm, demonstrating the ongoing volatility of winter weather in the Northeast.
Key Facts
- NESIS stands for Northeast Snowfall Impact Scale.
- The scale was created by Paul Kocin and Louis Uccellini in 2004.
- NCDC (National Climatic Data Center) updated the methodology in 2005 for future storm assignments.
- The Storm of the Century (1993) holds the highest NESIS value at 13.20.
- Storms are classified into five categories: Notable, Significant, Major, Crippling, and Extreme.
- The NCEI (National Centers for Environmental Information) publishes the official storm ratings.
Summary of Notable NESIS Storms
| Date | NCDC NESIS Value | Category | Description |
|---|---|---|---|
| March 12–14, 1993 | 13.20 | 5 | Extreme |
| January 6–8, 1996 | 11.78 | 5 | Extreme |
| January 22–24, 2016 | 7.66 | 5 | Extreme |
| March 2–5, 1960 | 8.77 | 4 | Crippling |
| March 11–14, 1888 | - | 4 | Crippling |
| February 11–14, 2014 | 5.28 | 4 | Crippling |
Frequently Asked Questions
What is the difference between the original NESIS and NCDC values?
The original values were computed by Kocin and Uccellini in 2004 for 70 historical storms. The NCDC recomputed values for 30 of those storms in 2005 using different data and methods to create a standardized process for rating all future storms.
Which storm is considered the most impactful in NESIS history?
The March 12–14, 1993, storm, known as the Storm of the Century, is the highest-ranking event with an NCDC NESIS value of 13.20.
How are NESIS categories determined?
Categories are determined by the NESIS numerical value, which reflects the snowfall distribution across populated areas. These range from Category 1 (Notable) to Category 5 (Extreme).
Who maintains the official list of NESIS storm ratings?
The National Centers for Environmental Information (NCEI), part of NOAA, publishes and maintains the list of storms and their corresponding ratings.
Does a high snowfall total always mean a high NESIS rating?
Not necessarily. Because NESIS focuses on snowfall distribution across populated regions, a storm with massive snowfall in an unpopulated area would rank lower than a storm with moderate snowfall that covers a major metropolitan corridor.