Holdridge Life Zones: Mapping Global Bioclimatic Patterns and Climate Risks
The Holdridge life zones system is a global bioclimatic scheme used to classify land areas based on their environmental characteristics. First published by Leslie Holdridge in 1947 and updated in 1967, this system provides an objective method for mapping ecosystems. It operates on a fundamental scientific assumption: once the climate of a region is known, both the soil types and the climax vegetation—the stable, final stage of ecological succession—can be accurately mapped.
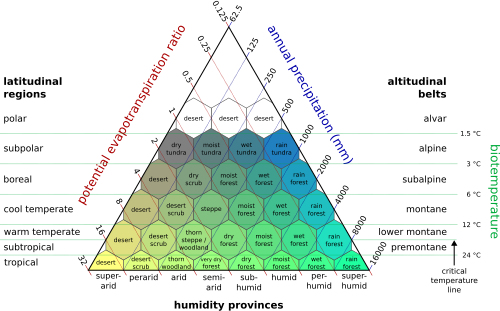
The Mechanics of the Holdridge System
While originally designed for tropical and subtropical regions, the system has proven effective for Mediterranean and boreal zones globally. However, it is less applicable to cold oceanic or cold arid climates, where moisture becomes the primary limiting factor. Unlike other systems that rely heavily on latitude, the Holdridge system prioritizes biotemperature.
The Three Primary Axes
The classification is built upon three major axes of subdivision:
- Precipitation: Measured on a logarithmic scale.
- Biotemperature: The mean annual temperature, also measured logarithmically. This is calculated by adjusting all temperatures below freezing and above 30 °C to 0 °C, reflecting the fact that most plants are dormant at these extremes.
- Potential Evapotranspiration (PET) Ratio: The ratio of PET to the mean total annual precipitation.
Potential Evapotranspiration (PET) represents the amount of water that would evaporate and transpire if water were unlimited. This differs from Evapotranspiration (ET), which is the actual sum of evaporation and plant transpiration. Because ET can never exceed PET, the ratio between precipitation and PET serves as an aridity index (AI). An AI below 0.2 indicates hyperarid conditions, while an AI below 0.5 indicates dry conditions.
![On this map, a shift of 1 indicates that at the end of the century, the region had fully moved into a completely different Holdridge zone type from where it had been historically. The extent of the shifts will be dependent on the severity of the climate change scenario followed.[8]](/images/67/b8/67b8a43aaea40842e632edffcfc015823f1055678a26b6dc7fa6d6e899446f6f.jpg)
Additional Indicators
To refine these classifications, the system incorporates several other environmental indicators:
- Humidity provinces
- Latitudinal regions
- Altitudinal belts
Key Facts
- Origin: Developed by Leslie Holdridge (1947/1967).
- Core Metric: Uses biotemperature, which accounts for plant dormancy by capping temperature values.
- Primary Use: Assessing how global warming shifts natural vegetation patterns.
- Aridity Index: Calculated as the ratio of Precipitation to PET.
- Global Scope: Applicable to tropical, subtropical, Mediterranean, and boreal zones.
Classification of Life Zones
The system categorizes the world into various classes ranging from polar deserts to tropical rain forests. These classes are used by organizations such as the International Institute for Applied Systems Analysis (IIAS) to model ecological shifts.
| Thermal Region | Example Vegetation/Climate Types |
|---|---|
| Polar & Subpolar | Polar desert, Subpolar moist tundra, Subpolar rain tundra |
| Boreal | Boreal desert, Boreal moist forest, Boreal rain forest |
| Cool Temperate | Cool temperate steppe, Cool temperate moist forest, Cool temperate rain forest |
| Warm Temperate | Warm temperate desert scrub, Warm temperate dry forest, Warm temperate rain forest |
| Subtropical | Subtropical desert, Subtropical thorn woodland, Subtropical rain forest |
| Tropical | Tropical desert, Tropical very dry forest, Tropical rain forest |
Climate Change and Agricultural Risks
As global temperatures rise, many regions are experiencing rapid shifts in their Holdridge life zone types. If species cannot adapt to these geologically rapid changes, they face extinction. This shift poses a significant threat to human food security by creating unstable weather conditions that deviate from historical norms.
The severity of the impact depends heavily on greenhouse gas emission scenarios:
- High-Emission Scenario (SSP5-8.5): Under this scenario, regions like South Asia, the Middle East, sub-Saharan Africa, and Central America face rapid shifts. This could push 31% of global crop production and 34% of livestock production outside of a "safe climatic space."
- Low-Emission Scenario (SSP1-2.6): In a scenario compatible with the Paris Agreement, only 5% of crop production and 8% of livestock production are expected to leave the safe climatic space.
![Areas of the globe where agriculture would become more difficult perhaps to the point of leaving the conditions historically suitable for it, under low-emission and high-emission scenarios, by 2100[8]](/images/51/79/5179e59939a4101f8bb0f38603dae405b9d87a3606fdf6bf3f7ef81609542f51.jpg)
Developing regions are particularly vulnerable. While developed nations may have the resources to adjust to shifting life zones, regions with lower social resilience may struggle to maintain stable agricultural outputs as their local climates transform.
Frequently Asked Questions
What is biotemperature in the Holdridge system?
Biotemperature is a measure of temperature adjusted for plant growth. It treats all temperatures below 0 °C and above 30 °C as 0 °C, because most plants are dormant at these extremes.
How does the system define aridity?
Aridity is defined by the ratio of precipitation to Potential Evapotranspiration (PET). A lower ratio indicates a drier environment, with an index below 0.2 signifying hyperarid conditions.
Why is the Holdridge system useful for predicting climate change impacts?
Because the system links climate directly to vegetation and soil potential, scientists can use it to model how changing temperature and rainfall patterns will shift entire ecosystems and agricultural zones.
What is the "safe climatic space" for agriculture?
The safe climatic space refers to the range of climatic conditions that are historically suitable for stable crop and livestock production. Rapid shifts in life zones can push regions outside of this space, making farming difficult or impossible.
How do different emission scenarios affect food security?
High-emission scenarios (SSP5-8.5) lead to much more drastic shifts in life zones, potentially impacting over a third of global food production, whereas low-emission scenarios (SSP1-2.6) significantly reduce this risk.