1968 Election Results: Richard Nixon's Victory and County Shifts
The 1968 presidential election was a pivotal moment in political history, characterized by a three-way contest between the Republican, Democratic, and Independent tickets. The results reflected a shifting political landscape, with Richard Nixon securing a decisive lead over his opponents.
In total, 127,205 votes were cast. Richard Nixon, representing the Republican Party, won with 70,927 votes, accounting for 55.76% of the total. Hubert Humphrey of the Democratic Party followed with 45,173 votes (35.51%), while Independent candidate George Wallace captured 11,105 votes, or 8.73% of the electorate.
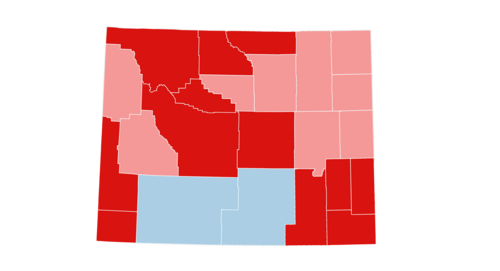
Key Facts
- Richard Nixon won the majority with 55.76% of the total vote.
- Hubert Humphrey secured 35.51% of the vote.
- George Wallace ran as an Independent, earning 8.73% of the vote.
- A total of 127,205 votes were cast across the measured counties.
- Twelve counties flipped from Democratic to Republican during this cycle.
Detailed Analysis of County Results
The distribution of votes across counties reveals significant regional variations. Nixon's strongest performance occurred in Niobrara County, where he secured 76.24% of the vote, and Johnson County, where he reached 73.85%.
Conversely, Hubert Humphrey found his strongest support in Sweetwater County, where he won 54.85% of the vote, resulting in a margin of -18.25% for the Republican candidate. Carbon County also leaned Democratic, with Humphrey taking 48.18% compared to Nixon's 44.77%.
The Impact of the Independent Vote
George Wallace, running as an Independent, maintained a consistent presence across most counties. His highest percentage of support was found in Campbell County, where he earned 11.37% of the vote, and Natrona County, where he received 11.22%.
Political Shifts and County Flips
One of the most notable aspects of this election was the number of counties that flipped—a term used when a jurisdiction changes its voting preference from one political party to another. In this election, twelve counties shifted from Democratic to Republican support:
- Albany, Big Horn, and Fremont
- Goshen, Hot Springs, and Laramie
- Lincoln, Natrona, and Park
- Platte, Sheridan, and Uinta
Election Summary Table
| Candidate | Party | Total Votes | Percentage |
|---|---|---|---|
| Richard Nixon | Republican | 70,927 | 55.76% |
| Hubert Humphrey | Democratic | 45,173 | 35.51% |
| George Wallace | Independent | 11,105 | 8.73% |
| Total | - | 127,205 | 100.00% |
Frequently Asked Questions
Who won the most votes in the 1968 election?
Richard Nixon won the most votes, totaling 70,927, which represented 55.76% of the total vote cast.
Which candidate ran as an Independent?
George Wallace ran as the Independent candidate, receiving 11,105 votes (8.73%).
Which county had the highest percentage of votes for Richard Nixon?
Niobrara County had the highest percentage for Richard Nixon, with 76.24% of the local vote.
Which counties remained or became Democratic strongholds?
Sweetwater County and Carbon County were the primary areas where Hubert Humphrey outperformed Richard Nixon.
How many counties flipped from Democratic to Republican?
A total of twelve counties flipped from Democratic to Republican, including Albany, Laramie, and Natrona.