Whanganui District Demographics and Population Trends
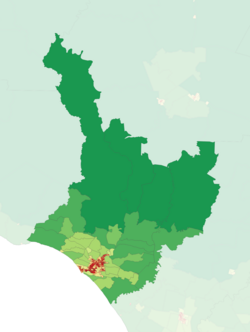
The Whanganui District is a diverse region characterized by a strong urban center and a vast natural landscape. Spanning 2,373.27 km (916.32 sq mi), the district is primarily defined by its main city, where the vast majority of the population resides. Outside the urban hub, the landscape is sparsely populated, with only a few outlying settlements, such as the notable village of Jerusalem.
As of June 2025, the estimated population reached 49,200, resulting in a population density of 21 people per km. This distribution highlights a concentrated urban living pattern, as only about 6,400 residents live outside the city limits.
Key Facts
- Estimated Population: 49,200 (June 2025).
- Census Population: 47,619 (2023).
- Median Age: 42.9 years, which is higher than the national average of 38.1.
- Primary Ethnicity: European (Pākehā) at 78.3% and Māori at 28.5%.
- Median Income: $32,500.
- Population Density: 21 people per km.
Population Growth and Distribution
Recent census data indicates a steady upward trend in the district's population. Between 2013 and 2023, the population grew by 5,466 people, representing a 13.0% increase. The most recent jump between 2018 and 2023 saw an increase of 2,310 people (5.1%).
| Year | Population | Annual Growth Rate (±% p.a.) |
|---|---|---|
| 2006 | 42,636 | — |
| 2013 | 42,153 | −0.16% |
| 2018 | 45,309 | +1.45% |
| 2023 | 47,619 | +1.00% |
Gender and Age Profiles
The 2023 census recorded 23,172 males, 24,282 females, and 162 people of other genders living across 18,909 dwellings. Approximately 3.0% of the population identified as LGBTIQ+.
The age distribution shows a significant concentration in the middle-to-older brackets. While 19.0% of the population is under 15 and 16.3% are aged 15 to 29, the largest group is those aged 30 to 64, making up 42.4% of residents. Those aged 65 or older account for 22.3% of the population.
Cultural and Social Composition
The district is ethnically diverse, with residents often identifying with more than one group. The largest ethnic groups are European (Pākehā) at 78.3% and Māori at 28.5%. Other groups include Asian (5.1%), Pasifika (4.1%), and Middle Eastern, Latin American and African New Zealanders (MELAA) at 0.6%. An additional 2.8% identified as "other," including those who listed their ethnicity simply as "New Zealander."
Language and Religion
English is the dominant language, spoken by 97.2% of the population, followed by the Māori language at 7.8%. Other languages are spoken by 6.3% of residents, and Samoan is spoken by 0.7%. New Zealand Sign Language is known by 0.8% of the population.
In terms of religious affiliation, a majority of residents (53.4%) report having no religion. Among those who do, 32.1% identify as Christian, 3.1% hold Māori religious beliefs, and smaller percentages identify as Hindu (0.8%), New Age (0.7%), Buddhist (0.5%), and Jewish (0.1%).
Education and Economic Status
Educational attainment varies across the adult population (those 15 years and older). While 12.6% hold a bachelor's degree or higher, a significant majority—56.5%—possess a post-high school certificate or diploma. Another 26.7% hold high school qualifications exclusively.
Economically, the district's median income stands at $32,500, which is lower than the national median of $41,500. High earners (those making over $100,000) represent 5.9% of the population, compared to 12.1% nationwide.
Employment Statistics
For residents aged 15 and older, the employment landscape is as follows:
- Full-time employment: 42.8% (16,524 people)
- Part-time employment: 13.9% (5,349 people)
- Unemployed: 3.7% (1,410 people)
Frequently Asked Questions
What is the current population of the Whanganui District?
As of the 2023 census, the population was 47,619, with an updated estimate of 49,200 as of June 2025.
How does the median age in Whanganui compare to the rest of New Zealand?
The median age in the Whanganui District is 42.9 years, which is notably higher than the national median age of 38.1 years.
What are the primary ethnic groups in the region?
The most prominent ethnic groups are European (Pākehā) at 78.3% and Māori at 28.5%.
What is the employment rate for adults in the district?
Among those aged 15 and older, 42.8% are employed full-time and 13.9% are employed part-time, while 3.7% are unemployed.
How does the income in Whanganui compare to the national average?
The median income in the district is $32,500, which is lower than the national median of $41,500.