Global GDP by Continent: Analyzing Nominal and PPP Economic Output
Measuring the economic output of entire continents provides a high-level view of global wealth distribution and industrial power. To do this, economists primarily use Gross Domestic Product (GDP), which represents the total market value of all final goods and services produced within a specific region during a given year.
However, comparing the wealth of continents is not straightforward. Economists use two primary lenses: Nominal GDP and Purchasing Power Parity (PPP). Nominal GDP is calculated using official government exchange rates, making it a reflection of a region's value in the international trade market. In contrast, PPP adjusts for the cost of living and inflation differences between countries, providing a more accurate picture of the actual standard of living and domestic purchasing power.
While nominal figures are sensitive to currency fluctuations—which can change a continent's rank without affecting the actual quality of life for its citizens—PPP figures are generally more stable and narrowly spread. Conversely, PPP does not reflect the true value of economic output in international trade and relies more heavily on estimation.
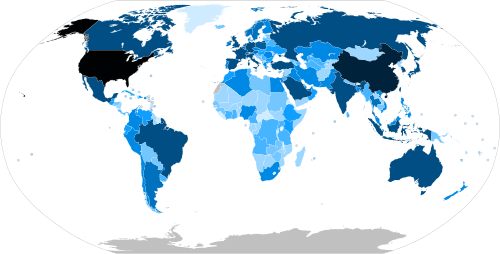
Key Facts
- Asia leads the world in total economic output, accounting for 35.5% of nominal GDP and 49.5% of PPP GDP.
- North America maintains the highest GDP per capita globally in both nominal and PPP terms.
- The United States and China are the most dominant individual national economies, collectively constituting a massive share of global GDP.
- Antarctica has no permanent population, but its economic activity (salaries and procurement) would exceed $1 billion if measured by conventional GDP methods.
- Africa has the lowest GDP per capita, though its PPP figures show a significant increase over nominal values.
Continental Economic Performance
The distribution of global wealth is heavily concentrated in three major regions: Asia, North America, and Europe. According to 2024 estimates from the International Monetary Fund (IMF), the World Bank, and the CIA World Factbook, these three continents dominate the global share of nominal GDP.
Nominal GDP Distribution
In terms of nominal value, Asia ranks first, driven largely by the massive economies of China and Japan. North America follows closely, with the United States accounting for 85.5% of the continent's total output. Europe remains a powerhouse, with significant contributions from Germany, the United Kingdom, and France.
Purchasing Power Parity (PPP) Shifts
When adjusting for the cost of living via PPP, the landscape shifts. Asia's dominance becomes even more pronounced, claiming nearly half (49.5%) of the world's total PPP GDP. This shift highlights the immense domestic production and consumption power within Asian markets, particularly in China and India.
| Continent | Nominal GDP (Billions USD) | Nominal Share (%) | PPP GDP (Billions Int$) | PPP Share (%) |
|---|---|---|---|---|
| Asia | 44,852 | 35.5% | 110,229 | 49.5% |
| North America | 37,889 | 30.0% | 40,657 | 18.3% |
| Europe | 32,326 | 25.6% | 46,142 | 20.7% |
| South America | 5,140 | 4.1% | 10,558 | 4.7% |
| Africa | 3,555 | 2.8% | 12,519 | 5.6% |
| Oceania | 2,449 | 1.9% | 2,486 | 1.1% |
GDP Per Capita and Standard of Living
While total GDP measures the size of an economy, GDP per capita (GDP divided by population) provides a better indication of individual prosperity.
North America leads this metric significantly, with a nominal GDP per capita of $62,424 and a PPP per capita of $66,984. Oceania and Europe follow as the next most prosperous regions. In contrast, Africa reports the lowest figures, with a nominal GDP per capita of $2,608, though this rises to $8,330 when adjusted for PPP, reflecting lower costs of living in the region.
Frequently Asked Questions
What is the difference between Nominal GDP and PPP?
Nominal GDP uses current market exchange rates to value goods and services, making it ideal for comparing international trade power. Purchasing Power Parity (PPP) adjusts for the cost of living in different countries, providing a more accurate measure of actual purchasing power and living standards.
Which continent has the largest economy?
Asia has the largest economy in both nominal and PPP terms, accounting for 35.5% of nominal global GDP and 49.5% of global PPP GDP.
Why does North America have the highest GDP per capita?
North America, driven largely by the United States, produces a very high market value of goods and services relative to its population size, resulting in the highest average economic output per person.
How is the GDP of Antarctica handled?
Antarctica has no permanent population and is generally excluded from standard rankings. However, if salaries and equipment procurement were counted, its GDP would exceed $1 billion.
Which countries contribute most to the global GDP?
The United States and China are the primary drivers of global wealth, collectively constituting the largest shares of the world's total nominal GDP.