Genetic Linkage: How Proximity on Chromosomes Shapes Inheritance
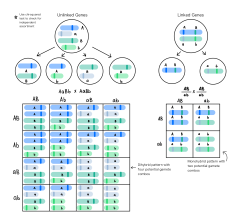
In the study of heredity, we often assume that traits are passed from parents to offspring independently. However, nature frequently deviates from this rule through a phenomenon known as genetic linkage. This occurs when DNA sequences located close to one another on the same chromosome tend to be inherited together during the meiosis phase of sexual reproduction.
When two genetic markers are physically near each other, they are less likely to be separated by chromosomal crossover—the process where homologous chromosomes exchange segments of DNA. Consequently, the closer two genes are, the lower the chance of recombination between them, and the more likely they are to remain together across generations. Conversely, markers on different chromosomes are considered perfectly unlinked.
Key Facts
- Genetic linkage is the primary exception to Mendel's Law of Independent Assortment.
- The centimorgan (cM) is the standard unit of linkage; 1 cM represents a 1% chance of recombination.
- Recombination frequency is used to estimate the genetic distance between two loci.
- A LOD score greater than 3.0 is generally accepted as strong evidence for linkage.
- Double crossovers can lead to an underestimation of genetic distance if not mathematically corrected.
The Discovery of Linkage
For decades, Gregor Mendel's Law of Independent Assortment served as the foundation of genetics, stating that every trait is inherited independently. This was challenged in 1905 by British geneticists William Bateson, Edith Rebecca Saunders, and Reginald Punnett.
While studying sweet peas, the researchers examined two specific traits: flower color (purple vs. red) and pollen grain shape (long vs. round). When they crossed pure lines (PPLL and ppll) and then self-crossed the resulting offspring, the results defied Mendelian expectations. Instead of the predicted 9:3:3:1 ratio, they observed a significantly higher frequency of parental phenotypes (purple/long and red/round) and a lower frequency of recombinant phenotypes.
| Phenotype and Genotype | Observed | Expected (9:3:3:1 Ratio) |
|---|---|---|
| Purple, long (P_L_) | 284 | 216 |
| Purple, round (P_ll) | 21 | 72 |
| Red, long (ppL_) | 21 | 72 |
| Red, round (ppll) | 55 | 24 |
This discrepancy proved that the genes for flower color and pollen shape were linked, meaning they were located close to each other on the same chromosome.
Measuring Genetic Distance
To quantify linkage, scientists use recombination frequency (θ), which is the rate at which a single chromosomal crossover occurs between two genes during meiosis. This frequency is expressed in centimorgans (cM). A distance of 1 cM means that markers are separated once per 100 meiotic products (or once per 50 meioses).
![Thomas Hunt Morgan's Drosophila melanogaster genetic linkage map. This was the first successful gene mapping work and provides important evidence for the chromosome theory of inheritance. The map shows the relative positions of alleles on the second Drosophila chromosome. The distances between the genes (centimorgans) are equal to the percentages of chromosomal crossover events that occur between different alleles.[5]](/images/b3/32/b332766bcc4ee67a9253c744ac1470dedc04e96af7f2177355e46d38806c42a8.webp)
The Impact of Double Crossovers
While recombination frequency is a reliable estimate of distance, it has limitations. If two loci are far apart, the likelihood of a double crossover increases. Because a double crossover effectively cancels out the first recombination event, the genes appear linked when they are not. For distances under 7 cM, this is unlikely, but for larger distances, mathematical models are required to avoid underestimating the genetic distance.
Linkage Analysis and the LOD Score
In human and animal populations, where controlled breeding is impossible, researchers use parametric linkage analysis. The primary tool for this is the LOD score (logarithm of odds), developed by Newton Morton.
The LOD score is a statistical test that compares the likelihood that two loci are linked against the likelihood that the observed data occurred by chance. The process generally involves:
- Establishing a family pedigree.
- Estimating various recombination frequencies.
- Calculating the LOD score for each estimate.
- Selecting the estimate with the highest LOD score as the most probable.
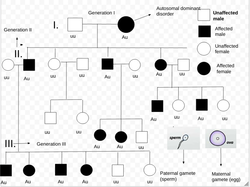
By convention, a LOD score > 3.0 indicates 1000:1 odds in favor of linkage, while a score < -2.0 is used to exclude linkage.
Advanced Insights: Intragenic Linkage and Variation
Genetic linkage exists not only between different genes but also within a single gene. Between 1955 and 1959, Benzer used rII mutants of bacteriophage T4 to demonstrate that mutation sites could be mapped linearly. This proved that genes are not indivisible "beads on a string" but have a linear structure equivalent to a length of DNA.
Furthermore, recombination frequency is not constant. Mutations in proteins involved in DNA processing can alter linkage. For example, in bacteriophage T4, mutations that reduce the expression of DNA polymerase (gp43), DNA ligase (gp30), or dCMP hydroxymethylase (gp42) increase recombination. Conversely, mutations in nuclease functions (gp46, gp47) or the uvsX gene (analogous to the recA gene in E. coli) reduce recombination, thereby increasing linkage.
Frequently Asked Questions
What is the difference between linked and unlinked genes?
Linked genes are located close together on the same chromosome and tend to be inherited together, resulting in a recombination frequency of less than 50%. Unlinked genes are either on different chromosomes or very far apart on the same chromosome, meaning they assort independently with a recombination frequency of 50%.
What does a centimorgan actually measure?
A centimorgan (cM) measures the genetic distance between two loci based on the probability of a crossover event. One centimorgan corresponds to a 1% chance that two markers will be separated during meiosis.
How is a LOD score used in medical genetics?
LOD scores are used to determine if a specific genetic marker is linked to a disease trait within a family pedigree. A score above 3.0 provides strong evidence that the marker and the disease gene are located near each other on the same chromosome.
Why do double crossovers cause problems in genetic mapping?
Double crossovers occur when two separate recombination events happen between the same two genes. This returns the alleles to their original parental configuration, making it appear as though no recombination occurred and leading to an underestimation of the actual distance between the genes.